Sustainable Pittsburgh, a nonprofit organization dedicated to promoting sustainable solutions among businesses and communities in southwestern Pennsylvania, needed an easy way to measure sustainability progress among the various communities in the region.
The Process
In consultation with the staff of Sustainable Pittsburgh, we discussed the dual priorities of the project – education and data solicitation – and strategized on how to appropriately balance these two objectives. We brainstormed about how we could use the Assessment process itself to fulfill educational objectives, and decided that this could be achieved in two complimentary ways. By incorporating information and definitions into the body of the Assessment, the act of completing it would improve knowledge. And by displaying results with insights and an interesting graphical presentation, users could broaden their understanding of the sustainability issues addressed in the Assessment.
The Solution
We built the new “Rapid Community Essentials” website to house the Assessment along with several pages of informational resources about sustainable communities. We did the complete graphical site design as well as the HTML/CSS/Javascript implementation. Programming for the Assessment and results display was done using an open source PHP programming framework (CakePHP) and MySQL.
Sorting data by community was a high priority, so we built the Assessment database to include the 10 counties and the 551 municipalities that make up the southwestern Pennsylvania region. This data was passed to the survey via drop down menus so that respondents could specify their county first and then their municipality.
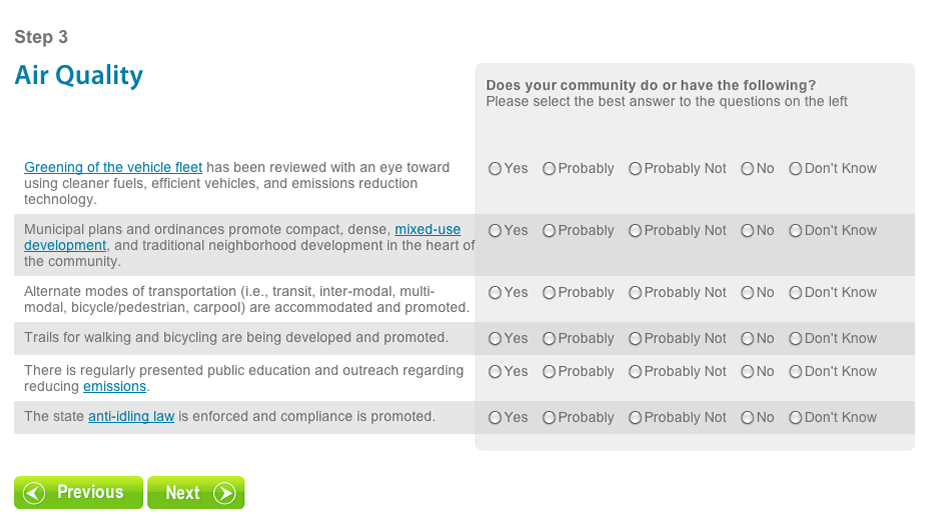
Because the Assessment was fairly long and included many topic areas, we built it as a multi-step wizard. After collecting location data, the wizard displays questions about 14 distinct areas of sustainability, from Air Quality to Water and Stormwater Management.
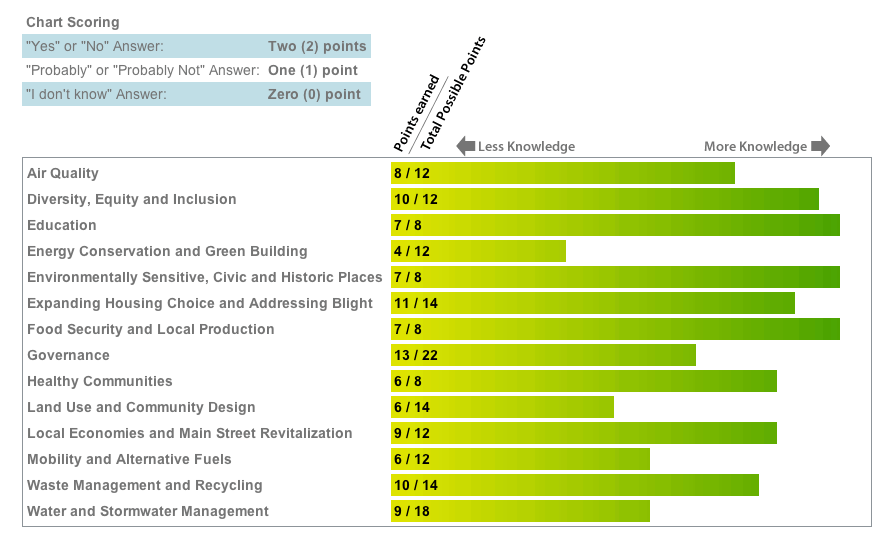
We built reporting functionality to give users immediate feedback after they completed the Assessment. This included a table to show their own community’s progress towards sustainability and a bar chart showing how knowledgeable they were based on the number of questions they were able to definitively answer for each sustainability topic area.
After the initial launch, we expanded the system by building an alternate version of the Assessment directed at specific designated Municipal Managers. Because this area was to be restricted, we also built a password and registration system.
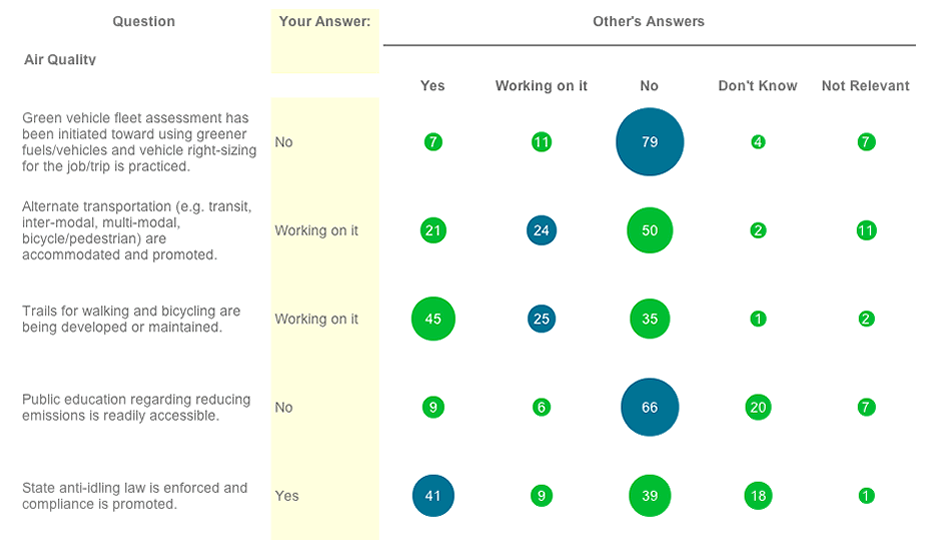
In a later phase we added enhanced reporting functionality including options to sort results by various criteria and to view results in both tabular and graphical form. We designed a circle chart presentation of the data to enable Municipal Managers to see a quick graphical overview of aggregate results as well as how their community compares to others in the region.
SERVICES PROVIDED:
- Web design
- Information architecture
- Web application programming
- PHP and CakePHP Programming
- MySQL
- Interface Design
- Dynamic Infographics Design
- HTML, CSS
- Javascript, jQuery